
Municipal Elections 2026: Part I
TikTok Analysis
During the Dutch municipal elections of March 2026, data was collected to detect bots on TikTok and analyze the toxic content being spread. Below is an explanation of the methodology used, while the following blogs will present the results.
Data
The collected data was specifically linked to the municipal elections. This was done through a list of election-related keywords and by monitoring public figures on TikTok. A control dataset consisting of TikTok posts on general topics and their associated comments was included for comparison.
Both datasets cover the period from 18 February 2026 to 1 April 2026 — from four weeks before the municipal elections until two weeks after.
TikTok analysis: How is the bot score calculated?
The bot score ranges from 0 to 1: the higher the score, the more bot-like the behavior.
Three Signals
The system evaluates three independent timing-related signals and combines them into a single score.
Repeated messages: How regularly are identical texts posted?
The system groups together messages that are (nearly) identical. If multiple accounts post almost the same text, the system examines the intervals between those posts: are they published at fixed, predictable moments?
Example: if 10 accounts all post the exact same message every 5 minutes or every 4 hours, this is considered suspicious. Real people do not repeat themselves with such precision.
Regular intervals → high score (bot-like)
Random, varying intervals → low score (human-like)
This signal accounts for 40% of the final score.
Posting behavior per account: how regularly does this person post?
For each individual account, the system analyzes the rhythm of all posts across the entire period: are the intervals between posts relatively equal, or do they vary significantly?
Example: someone posting every day at exactly 08:03, 14:03 and 20:03 shows almost robotic behavior. Someone who posts three times one day and then disappears for two days behaves more like a real person.
Regular intervals → high score
Irregular and varied behavior → low score
This signal accounts for 35% of the final score.
Response speed: how quickly does the account reply?
The system measures how quickly a response appears after the original post was published.
Example: if someone replies within seconds to every post, this may indicate automation. Real people usually need time to read, think, and respond.
The formula works as follows:
Reply within seconds → score close to 1.0 (bot-like)
Reply after 1 hour → score approximately 0.37
Reply after 3 hours → score approximately 0.05 (human-like)
This signal accounts for 25% of the final score.
Combining the signals into one score
The three signals are weighted together into a single score between 0 and 1. A smart principle is applied: a signal that strongly indicates bot behavior automatically weighs more heavily. If two of the three signals clearly point toward automation, the system compensates for the third signal even if it is missing or weaker.

In summary: an account that repeatedly posts the same text, always posts at fixed times, and reacts extremely quickly will receive a score close to 1.0. An account that only stands out on one of the three indicators receives a lower score unless that one signal is exceptionally strong.
This leads us to the following figures for the 2026 municipal elections:

Bot Score Posts TikTok GR26 2026/02/18 - 2026/04/01
412 posts originated from accounts that were highly likely to be bots. More than 3,000 additional posts likely came from bot accounts.
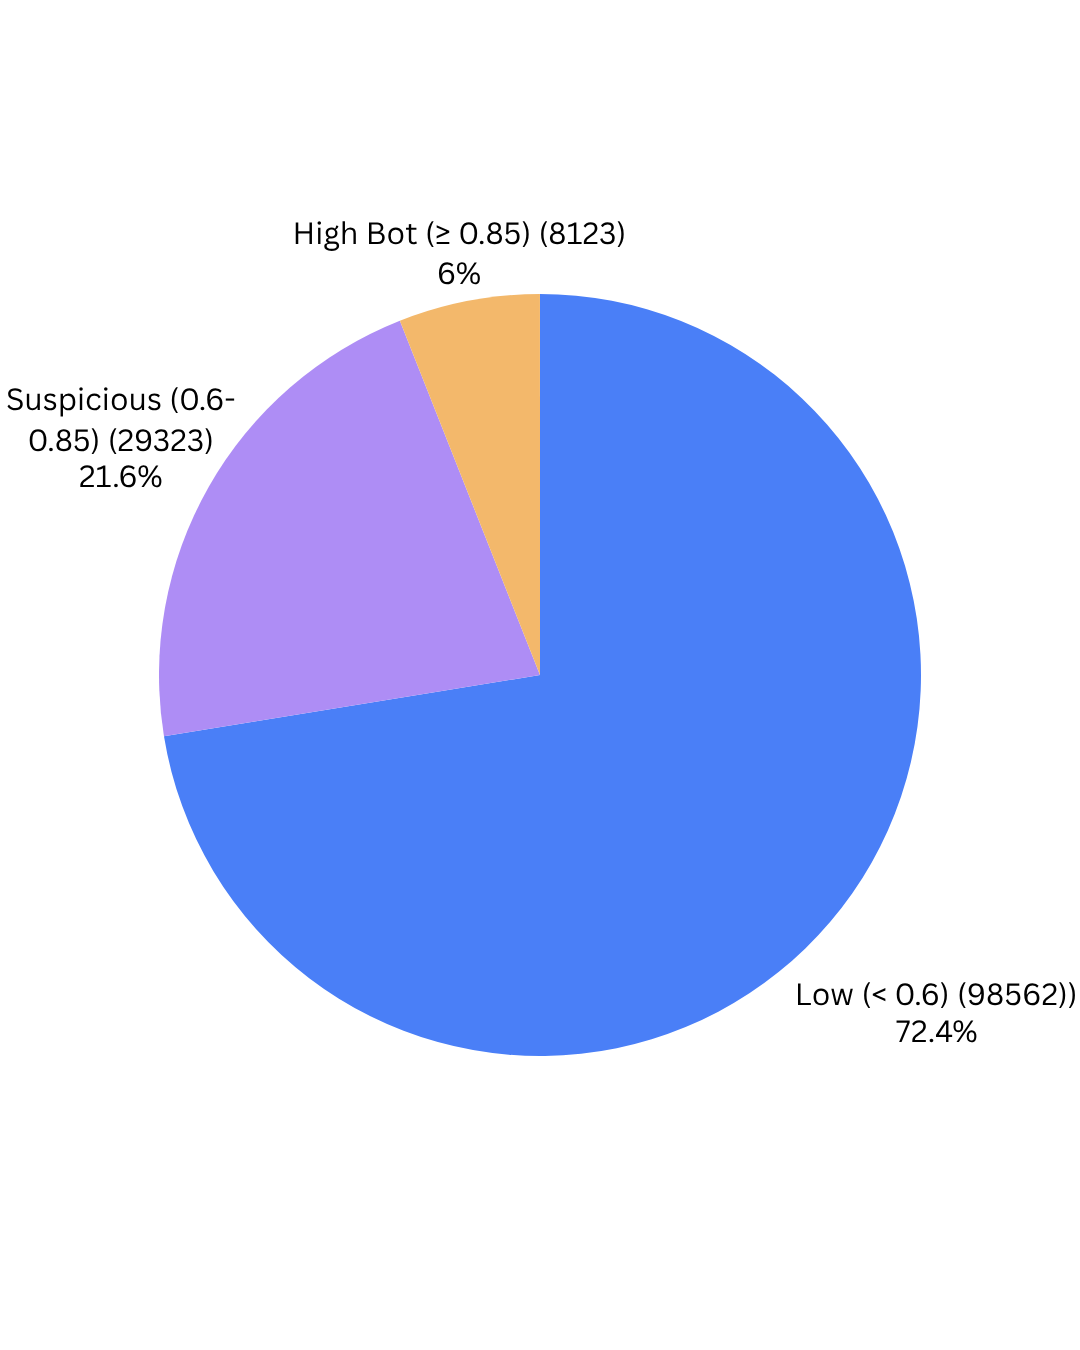
Bot Score Comment TikTok GR26 2026/02/18 - 2026/04/01
8,123 comments most likely originated from bot accounts, while 29,323 comments were suspected to come from bot accounts.
In the two pie charts above, showing the bot-score distribution of TikTok posts, we observe a similar distribution of bot scores between the municipal-election-related dataset and the control dataset.
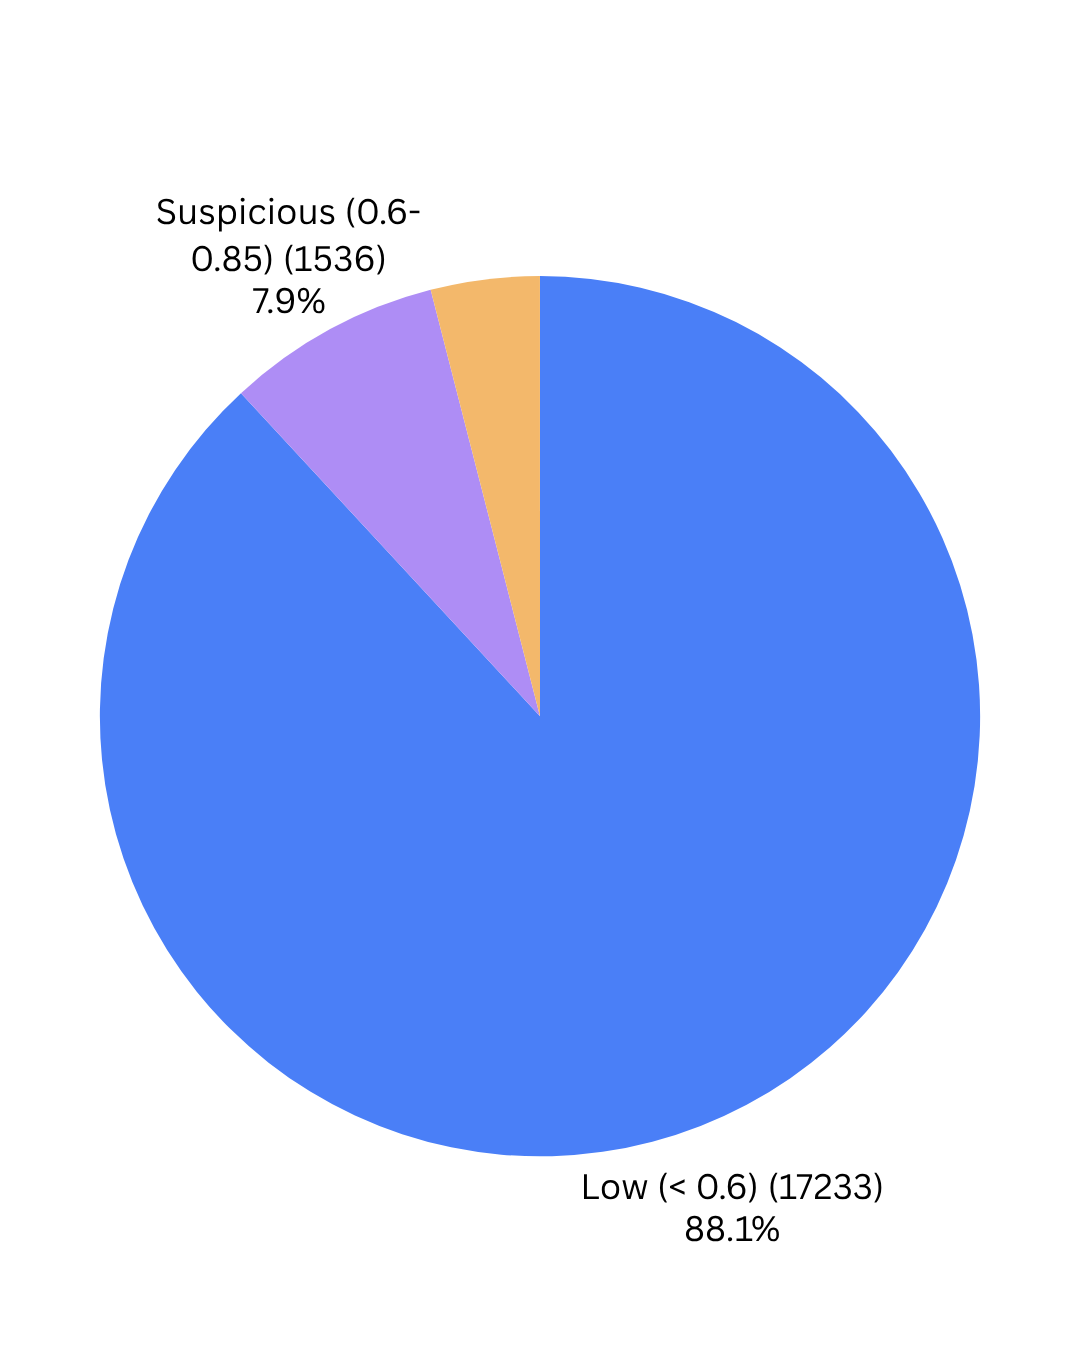
Bot Score Comment Controle TikTok GR26 2026/02/18 - 2026/04/01
However, in the figures related to comments on the TikTok posts, there is a significant difference. The dataset specifically collected in the context of the 2026 municipal elections contained approximately 15 percent more suspicious comments than the control dataset.
The three visualizations: toxic bot content during the Dutch municipal elections of 2026
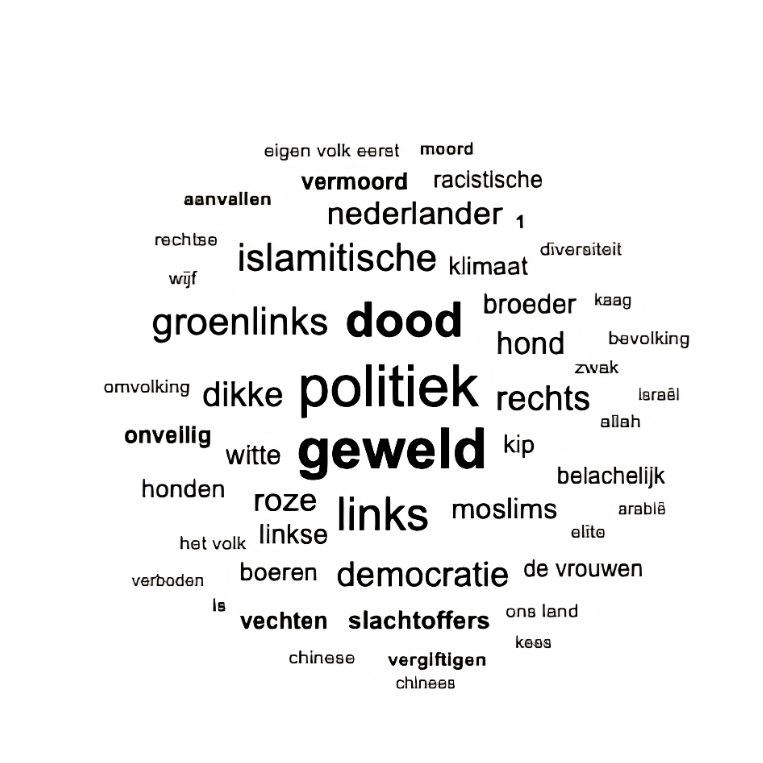
Top 50 Keywords ( THREAT= bold)- 2026-05-18 © EOOH
The three visualizations clearly show that toxic bot content during the Dutch municipal elections of 2026 was strongly dominated by political polarization, where anti-immigration, anti-Muslim, and violent narratives were closely intertwined.
The word cloud containing the fifty most frequently used terms demonstrates that words such as “politics,” “violence,” “death,” “left,” and “right” occupied a central role within the online discourse. At the same time, explicitly stigmatizing terms such as “Islamic,” “Muslims,” “great replacement,” and “our own people first” appeared frequently, indicating the continued presence of far-right and xenophobic narratives in online election debates.
Notably, political oppositions (“GroenLinks,” “left,” “right”) were constantly combined with hostile or violent terminology, framing political discussion strongly in terms of conflict, threat, and societal disruption.
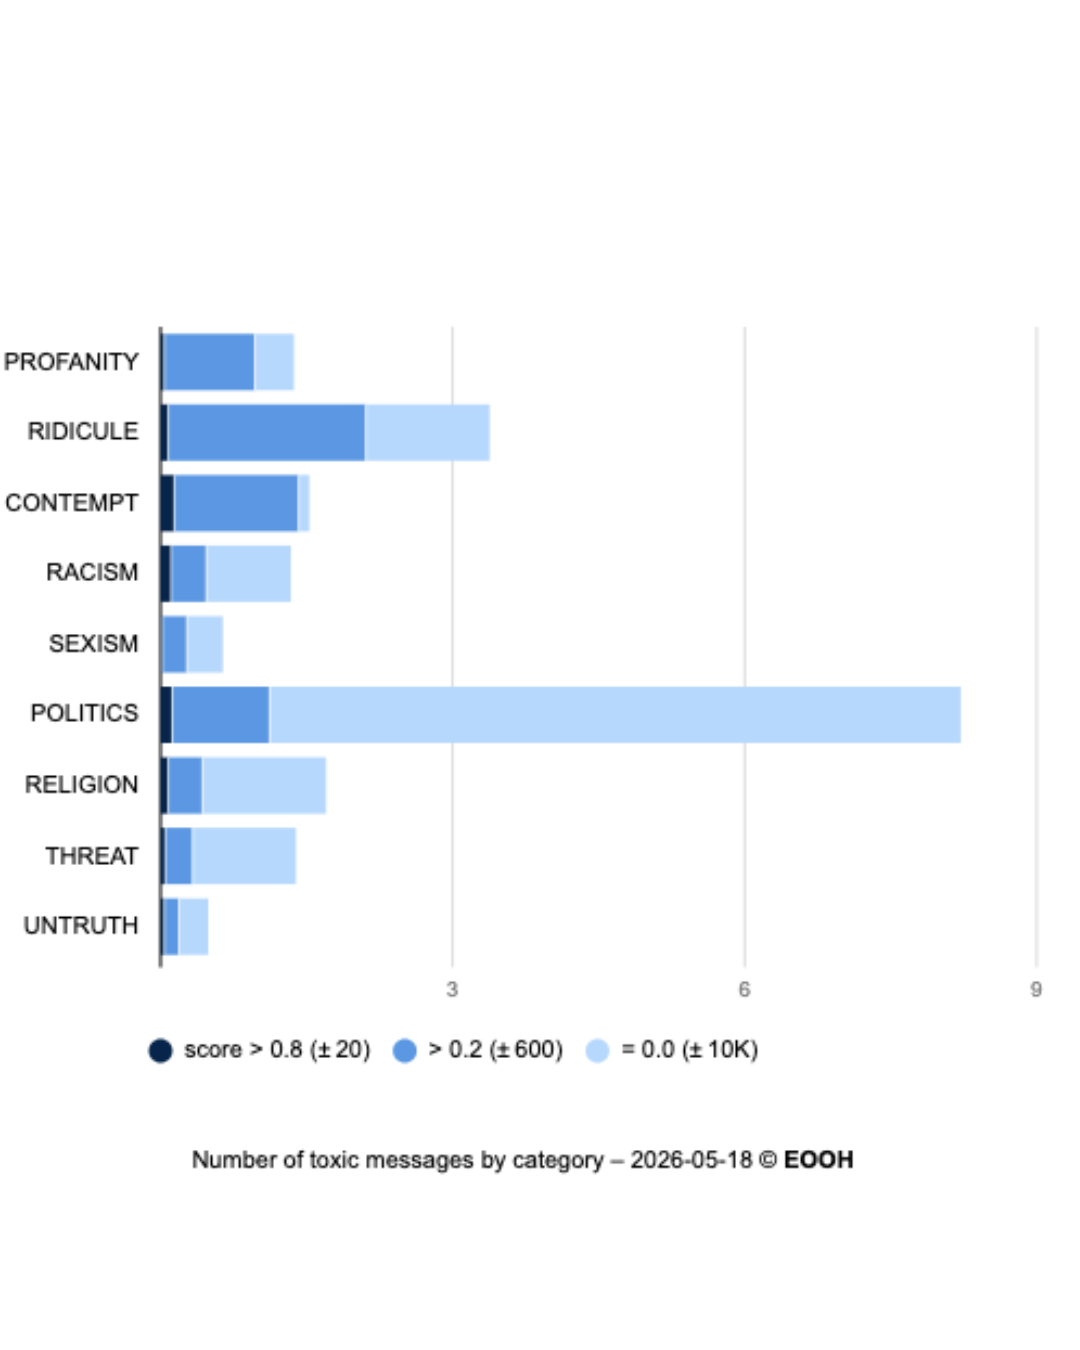
Number of Toxic Messages by Category- 2026-05-18 © EOOH
Second visualization
The second visualization confirms that political content formed by far the largest category within the toxic message stream. Categories such as “ridicule,” “contempt,” “racism,” and “threat” were also highly prominent.
The presence of threatening language and racist framing demonstrates that online election discussions did not remain limited to sharp political criticism, but frequently evolved into hostile and dehumanizing communication.
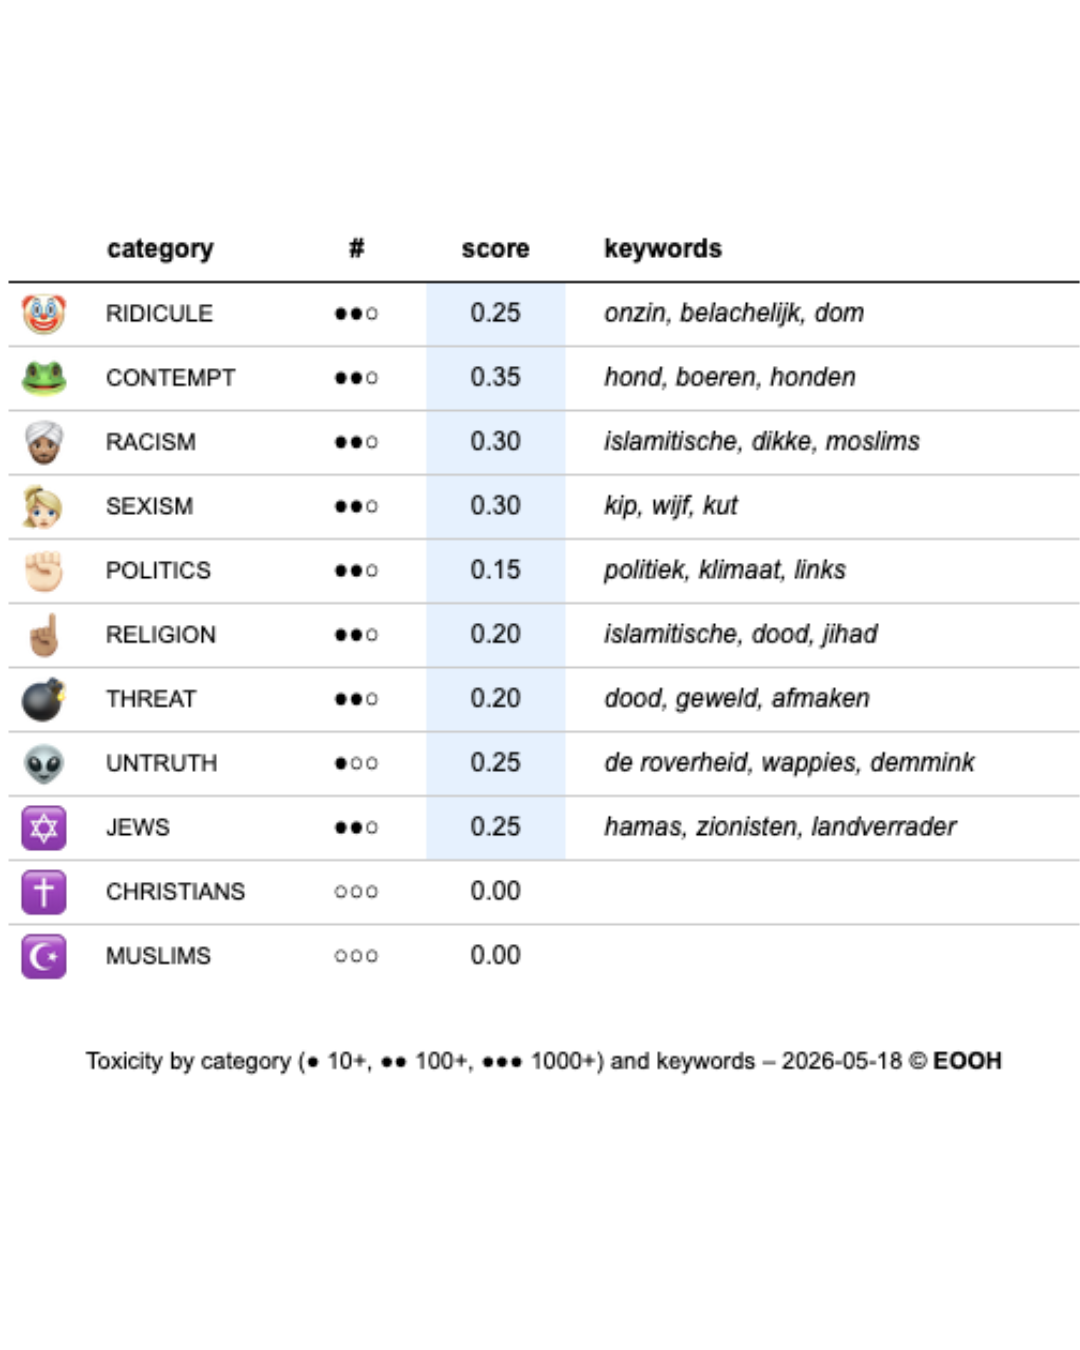
Third visualization
The third visualization provides more insight into the substantive nature of this toxicity.
The category “contempt” achieved the highest toxicity score (0.35), including terms such as “dog,” “farmers,” and “dogs,” indicating dehumanization and humiliation of specific groups.
The category “racism” also scored highly, with terms such as “Islamic,” “fat,” and “Muslims” appearing prominently. This demonstrates that anti-Muslim rhetoric and discriminatory references played a major role within toxic bot content.
The category “threat” included words such as “death,” “violence,” and “finish them off,” indicating that violent rhetoric remained structurally present within online debate.
Additionally, disinformation-related terms such as “wappies,” “the regime,” and “Demmink” appeared within the category “untruth,” suggesting that conspiracy theories and distrust toward institutions were intertwined with hateful discourse.
Taken together, the visualizations illustrate how toxic bot content during the municipal elections was not merely about traditional political disagreements, but rather about the amplification of polarizing narratives centered on migration, Islam, national identity, and societal threat.
The combination of political framing, racist references, conspiracy theories, and violent language points toward an online environment in which bots contribute to the normalization and amplification of hostile discourse. This not only creates a more toxic digital debate, but also reinforces feelings of societal insecurity, polarization, and distrust toward democratic institutions and minority groups.