
Municipal Elections 2026: Part V
Analysis: Top 10 accounts and Preliminary Findings
Top 10 accounts
The top 10 accounts based on attracted engagement between 18 February – 1 April 2026. “Unique responders” are the number of different accounts that responded to this account’s content.
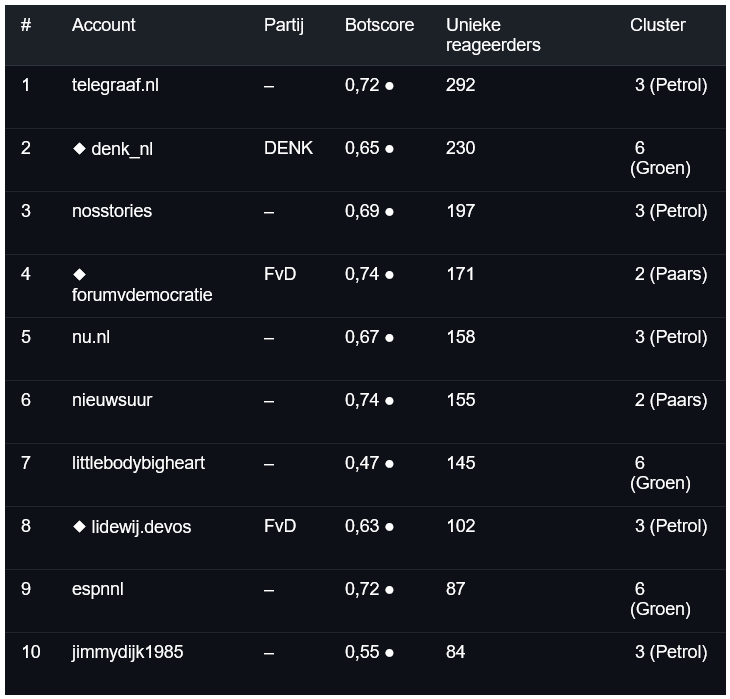
Ranking by Attracted Engagement
● Orange = bot score 0.6–0.85 (suspicious) ● Green = bot score below 0.6 (likely organic)◆ = monitored politician
Ranked by unique responders (out-degree) in the directed graph.
Observations About the Top 10
8 out of the 10 top accounts fall within the orange (suspicious) bot-score range. However, accounts 1–6 are well-known Dutch national news organizations (De Telegraaf, NOS, nu.nl, Nieuwsuur) and political party accounts (DENK, FvD).
For organizations using scheduled publishing pipelines, a higher bot score is expected and does not necessarily indicate inauthentic behavior — see Preliminary Findings for a more detailed discussion. Account 7 (littlebodybigheart) stands out: with 145 unique responders and a green (organic) bot score of 0.47, it attracted a large amount of engagement without suspicious timing patterns. It may be worthwhile to investigate what type of content generated this engagement. Account 10 (jimmydijk1985) also has a green bot score (0.55), making it appear to be a regular high-reach account.
Bot Score ≠ Inauthentic Account
Several top accounts in this table are mainstream news organizations.Their orange bot scores likely reflect automated publishing pipelines (scheduled posts, social-media feeds) rather than coordinated inauthentic behavior. Bot scores should always be interpreted in the context of the known identity and publishing practices of the account.
Preliminary Findings
Carefully cautious observations about the specific data shown in these graphs. These are starting points for investigation, not conclusions.
Read this First
All observations below are preliminary, and are based solely on the interaction data within this network during the period 18 February – 1 April 2026. Therefore, they do not constitute proof of any activity.
Moreover, manual investigation, additional data sources, and editorial judgment are required before drawing conclusions about specific accounts or organizations.
First Findings: The Network Is Dominated by Dutch Mainstream Media and Political Parties
The top accounts based on attracted engagement are all well-known Dutch entities: De Telegraaf, NOS Stories, Nieuwsuur, nu.nl (media), and DENK and Forum voor Democratie (political parties).
This suggests that the monitored dataset primarily captures discourse surrounding Dutch national politics and media coverage — consistent with a monitoring period coinciding with the Dutch municipal elections of 2026.
Second Findings: Orange Bot Scores for Media Accounts Are Expected, Not Alarming
8 of the top 10 accounts fall within the orange (suspicious) bot-score range (0.63–0.74). However, four of these are major news organizations (De Telegraaf, NOS, nu.nl, Nieuwsuur) that publish content on automated schedules.
Fixed publishing schedules naturally produce timing patterns that resemble bot behavior. These scores should therefore not be interpreted as evidence of inauthentic activity for known news organizations. They would, however, warrant further investigation if observed on anonymous or lesser-known accounts.
Third Findings: FvD verschijnt in twee afzonderlijke clusters naast zeer verschillende accounts
Further Research Recommended:
Forum voor Democratie (forumvdemocratie) appears in Cluster 2 (Purple) together with the public broadcaster Nieuwsuur. At the same time, FvD politician lidewij.devos appears in Cluster 3 (Teal) alongside mainstream media accounts telegraaf.nl and nu.nl.
This means that FvD-related content is embedded within the same interaction patterns as mainstream news organizations — either due to reporting about the party or because of shared audiences responding to both. This cross-cluster pattern involving a single political party is notable and deserves further investigation.
Fourth Findings: Clustervorming is door de hele grafiek sterk
All six clusters score between 0.60 and 0.74 on the modularity scale. This indicates that the network is genuinely divided into distinct bubbles — accounts primarily interact within their own clusters and have limited cross-cluster dialogue. In a healthy and diverse online discourse, one would expect more interaction across clusters.
The current structure suggests a clear, relatively self-contained audience group that does not regularly communicate across cluster boundaries.
Fifth Findings: Cluster 4 is uitzonderlijk samenhangend en verdient onderzoek
Further Research Recommended:
Cluster 4 (Orange, 13 accounts, modularity 0.74) is the most internally cohesive cluster in the network.
Although the two identified accounts (vvd.rotterdam and luna.hoogendam) are local political accounts, the identities and roles of the remaining 11 accounts are unknown based on this graph alone.
The high cohesion means these 13 accounts interact almost exclusively with each other, and may indicate:
a coordinated local political network;
a closed engagement group, or simply a tightly connected local political community.
Sixth Findings: Cluster 5 Is a Microcluster Requiring Manual Investigation
Further Research Recommended:
Cluster 5 (Pink) contains only 4 accounts but has a modularity score of 0.72, meaning these four accounts interact almost exclusively with each other. Small, closed, highly cohesive groups are patterns sometimes associated with coordinated engagement. The specific identities of these four accounts are not visible in the top-account table, suggesting they are not high-reach accounts.
Manual inspection of these four accounts is recommended.
Final Findings: Most of the Active Network Is Not Visible Here
The displayed 87–89 accounts represent approximately 1.3% of the more than 6,800 accounts active during this period. The remaining 98.7% — including potentially suspicious accounts with low interaction volumes — are not visible in these graphs.
The current visualization therefore only shows the most prominent layer of the interaction ecosystem. A fuller understanding would require investigation of the broader (and significantly more complex) network of all active accounts.
Disclaimer
All signals are probabilistic estimates derived from interaction and timing patterns. Bot scores are indicative rather than definitive. A high score does not confirm automated or inauthentic behavior, and a low score does not rule it out.
Cluster membership reflects observed interaction patterns. Ideological alignment may influence these patterns, but the clustering algorithm does not directly measure ideology, affiliation, or intent. Manual investigation is required before drawing conclusions about specific accounts, organizations, or communities.
These graphs are interaction maps showing which social media accounts responded to one another's posts during the monitored period. Each node represents an account, and each connection indicates that one account responded to content posted by the other.
The graphs can be understood as maps of conversations that illustrate:
1. Which accounts interacted with each other's content.
2. How those accounts formed groups or clusters.
During the monitored period, between 6,824 and 6,826 accounts were active in the dataset. For readability, each graph displays only the 87 to 89 most connected accounts, approximately the top 1 to 2% by engagement. The remaining thousands of less active accounts were excluded to prevent the visualisation from becoming an unreadable mass of nodes and connections.